A Simple Strategy for Trading, which you can TRUST.
Premium Formulas.
Whatever trading style you work with, our advanced expert tool, Bhoomi Indicator, can help you take your trading experience to the NEXT LEVEL.
Accurate Levels
Advanced Directional Indicator
Improved Risk:Reward
Enhanced Trading Skills
Trading doesn’t have to be complicated!
With Bhoomi Indicator, You will get…

Trading Signals

Absolute levels

Market Sentiments

Monthly Superlist

Live Support

Subscribe Our Best Indicators
▴
Subscribe Our Best Indicators ▴
-
For NSE/BSE stocks (equity/futures), Nifty & Banknifty
₹3499/m -
For markets that include Global Indices, including Nifty/Banknifty
₹1999/m -
For all Nasdaq stocks (equity and futures)
₹2499/m -
Includes Foreign Exchange Pairs from significant exchanges.
₹1999/m -
For Commodity Market including MCX exchange for Indian traders.
₹5999/m -
One indicator covers “All the Financial Markets.”
₹9999/m -
Daily options trading calls for Nifty and Banknifty and stock options via WhatsApp broadcast.
Reach out to WhatsApp to subscribe.
₹3499/m
*for any query to subscribe, contact Whatsapp
About Us
-
![]()
"You never know what kind of setup market will present to you, your objective should be to find an opportunity where risk-reward ratio is best"
Karthik P.
-
![]()
"If I can do this, anyone can! Trading is complicated if you don't have the patience and dedication to learn about this magical world of technical analysis."
Raksha K. S.


FAQs
-
Sign up to any plan on our website.
If you are not having TradingView account, you can use this link and avail some discounts on your plans with Tradingview account.
After signing up, please fill in the form and check the email we sent you with the necessary links.
If you are having trouble, you can always email info@niftyanalysis.in with your TradingView & Discord usernames, and our support team will grant you full access within 9 hours.
-
Bhoomi signals do not repaint, appear in real-time, and are confirmed on candle close. Repainting is where signals change based on data in the future to make them appear different than they are.
Once a signal is confirmed on candle close, it will be there forever.
-
You don't need to upgrade TradingView, BHOOMI works with 100% feasibility on the basic plan of TradingView (free). You can sign up for free here.
TradingView supports real-time data for the majority of tickers you can find on the platform. Only a small portion of them (primarily futures contracts) require a small monthly fee to access real-time data. Thus, , unless you want to go for it personally, you don't need to go for any paid version to use Bhoomi on your charts.
-
We have designed Bhoomi as expert advice you can use to create your own & unique trading strategies, in addition to guiding you in case you are an amateur trader. Our indicators were not designed for auto-trading, but we plan to have them soon as a part of our future updates.
For a trader, it is difficult to scan 200 stocks every hour, especially when he is in an active trading session, and in this course of action, you may miss the high potential trade entry just to find where #bhoomi has given entry and on which stock. So for this, we have created “Bhoomi screener”. This is your alert ticker as to which stock has given entry as per Bhoomi. You can simply check which stock is on the list and then you can enter as per the set rules of Bhoomi. You will receive the details of creating your account with Bhoomi screener once you have subscribed with us.
-
To answer first what market it covers, Bhoomi covers every market of this financial world, including stocks, indices, forex, futures, and commodities.
To make things easy and user-friendly, we have the following variants as per your necessity:
BHOOMI NSE: For NSE stocks and Nifty, BankNifty.
BHOOMI COMEX: For commodity pairs worldwide, including MCX pairs.
BHOOMI FX: For forex pairs worldwide on significant exchanges.
BHOOMI INDICES: For trading global indices like SPX, US100, DE30, Nikkie, etc.
BHOOMI NASDAQ: For trading Nasdaq stocks.
BHOOMI MAYA: This variant covers all the above markets with additional markets of cryptocurrency, specially designed for hedge-fund managers or those who are interested in more than one market, so a single umbrella variant for them to work on all the markets of interest.
Bhoomi works in all timeframes, including 3m, 15m, 30m, 1H, 4H, 1D, 1W, etc. You can utilize our tool for scalping, swing trading, investment purpose, or even trading options. For intraday, we suggest trading on a 3min timeframe, taking support of higher timeframe trend based on Bhoomi zones and trend stars and absolute levels.
-
A signal is confirmed only once the candle is closed, on whatever time frame you are working with.
A signal could appear on your chart but is not confirmed until that candle is closed and the next candle has started. The reason is that there is a lot of activity during the formation of a candle; once the candle closes, it confirms our rule-based signals.
-
Signals are not meant to be followed blindly and are best used as additional confirmation alongside your trades, hence the name "Confirmation Signals.”
Though based on our subscribers’ feedback and our own experience, it has always given us an accuracy of above 80-85% when traded with guidelines and rules.
-
Bhoomi works only on TradingView (a free web-based charting platform), and you can trade anywhere based on those charts. It will be your charting support, and based on it, you can trade on any platform like Zerodha, Upstox, etc., or any other local trading platform.
PRODUCT QUERIES
For the curious traders, whose questions heads this chapter
SUBSCRIPTION QUERIES
For the curious traders, whose questions heads this chapter
-
We do not provide any trial versions for Bhoomi Indicator. With the quality of trade setups, you won’t need the trial anyways ;)
-
After signing up and filling in the form after payment, it takes a maximum of 2-12 hours to activate your account.
If you have any issues, you can email us at info@niftyanalysis.in or Whatsapp us on +91 7396564111.
-
Your subscription will automatically cancel once the period of a month from the day you subscribe ends.
You must follow the same procedure you followed the first time to subscribe to Bhoomi Indicator.
-
You can upgrade your monthly subscription anytime by emailing at info@niftyanalysis.in or sending a Whatsapp message on +917396564111 or simply paying the subscription for quarterly, semi-annually, and annually plans as mentioned on our product page.
You can save from 10% to 20% on lump-sum plans.
-
Yes you can, please send the new username along with your old username to info@niftyanalysis.in and we will adjust this for you within 12 hours.
-
It happens in two cases:-
Your subscription has expired.
If you've already been given access to Bhoomi with an active subscription and you're seeing this alert, refresh your browser and make sure you're logged in on the TradingView profile you entered. Also, check if the "extended hours" option is enabled in your chart settings. If yes, disable it. If that still doesn't work, email us at info@niftyanalysis.in
-

What is Bhoomi Indicator
-

Whats is Trading View
-

What is Discord
WHAT IS BHOOMI 2.0?
Bhoomi 2.0 is an advanced market directional indicator. It works on the idea of catching the market direction before it happens, thus making it one of the leading indicators, which we call as Market Expert Advice.
It is a combination of various segments, having their significance while making trading decisions. These segments are:
1) Demand & Supply Zone:- These are the areas that show us whether there is a demand in the market or supply in the market. The significance of these zones is that in the green zone, i.e., the demand zone as prices are bullish, we look for only buying opportunities. Similarly, in the red zone, i.e. supply zone prices are bearish, so we look for selling opportunities only. It shows dedicated sentiments of that particular time frame that you are having on your screen. It means a 3min chart will show the sentiment for a 3min time-frame and 1hour will show sentiment for 1hour. It changes as you change the time-frame. Then there is white zone (or black zone if you are using dark mode in tradingview chart), which means no trade zone, and no fresh trades are to taken when price is in this area.

2) Trendstars: These are the indication of immediate trend of that time-frame which you are working on. There are two types of stars, Green star showing uptrend, and Red star showing downtrend. Any buying decision is taken after confirmation of a green star on the chart and a sell decision is taken after the confirmation of downtrend by a red star. These stars are also used as an entry criteria provided they are formed withing the zone and are as per entry rules of Absolute Levels. Trendstars are also used as an exit criteria on positional/option trading strategies.

3) Buy and Sell Label: These labels are for buy and sell entries. These denotes the fair price entry at that particular time-frame. Any buy/sell labels specially for intraday are taken with help of Absolute Levels. When such labels are formed at the given level of Absolute levels, we enter for a trade. For higher time frame, these labels can be used alone for entry criteria keeping in mind the zones and trendstars.

WHAT IS TRADING VIEW?
TradingView is a social network of 15 million traders and investors using the world's best charts and analysis tools to spot opportunities in global markets. Use this platform to follow your favorite assets, find trading ideas, chat with others, spot trends, and place trades directly on our charts.
This is the platform where we give access to BHOOMI 2.0 indicator. To access the amazing features of Bhoomi, you need to have an account in TradingView (the basic plan is apt to use the full features of Bhoomi 2.0.)
If you are a new trader, it comes with a feature called PAPER TRADING. So you can practice our trade rules based on Bhoomi to gain confidence before you go for trades involving real money.
How To Create A TradingView Account
To open an account (or sign-in) in tradingview, visit the website www.tradingview.com and click on the sign-in tab on the top right corner of your screen. Once you click you will be directed to different methods of signing in. (follow the next image)

You will have various options to sign-up with Tradingview. In addition to this, you can also have a trial version of paid versions of TradingView for 30days.

How To Open A Chart On TradingView
Once you are ready to go, click on Charts button to open a chart. If you are in India, by default it will open Nifty chart. ( it will redirect to in.tradingview.com for Indian version)


How To Change Symbol
Click on the top left side of chart to change the symbol. If you know the symbols, you can directly type it in the box else search in the list box of symbols by clicking on the name as marked in first image.


Change Chart Timeframe
To change the timeframe of your chart click on the section at the right of the ticker name and select the timeframe of interest. You can also type the timeframe directly on your keyboard to change it by keyboard shortcut by pressing “,” comma button.

How to Put Indicators To Your Chart
Click on the fx symbol at the top of the chart, this will open a menu, search for the indicator and click on it to add it to the chart. Keyboard shortcut to this is “/” button.

How to Save A Chart Layout
In a chart, you can experiment and work on many indicators, drawing tools like Fibonacci levels, trendlines, etc., and to keep your study safe, you can save the chart layout for future reference. To do so, you can clock on the dotted cloud button until it shows a click on the icon. It means it is saved. You can rename, duplicate and do other functions by clicking on the dropdown box from the same button. You can also save a chart layout by pressing ctrl + s or cmd + s

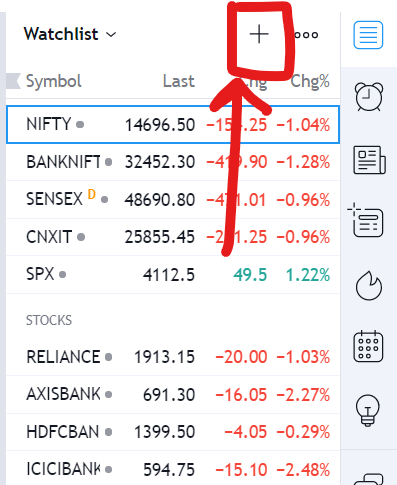
Make a watchlist of your own selective stocks/commodities/index etc.
To keep an eye on your own selective scripts, you can create your own watchlist by clicking on the plus sign and adding the scripts of your own choice.

For any other queries
You can contact the Help center for any other queries and FAQs related to tradingview.

WHAT IS DISCORD?
Discord is an invite-only a voice, video, and text chat app. Discord servers are organized into topic-based channels where you can collaborate, share, and just talk about your day without clogging up a group chat.
On clicking the Invite link shared, simply follow the suggested steps to sign-up and enjoy a community concentrating on the vast knowledge of related topics. To know more visit discord.com